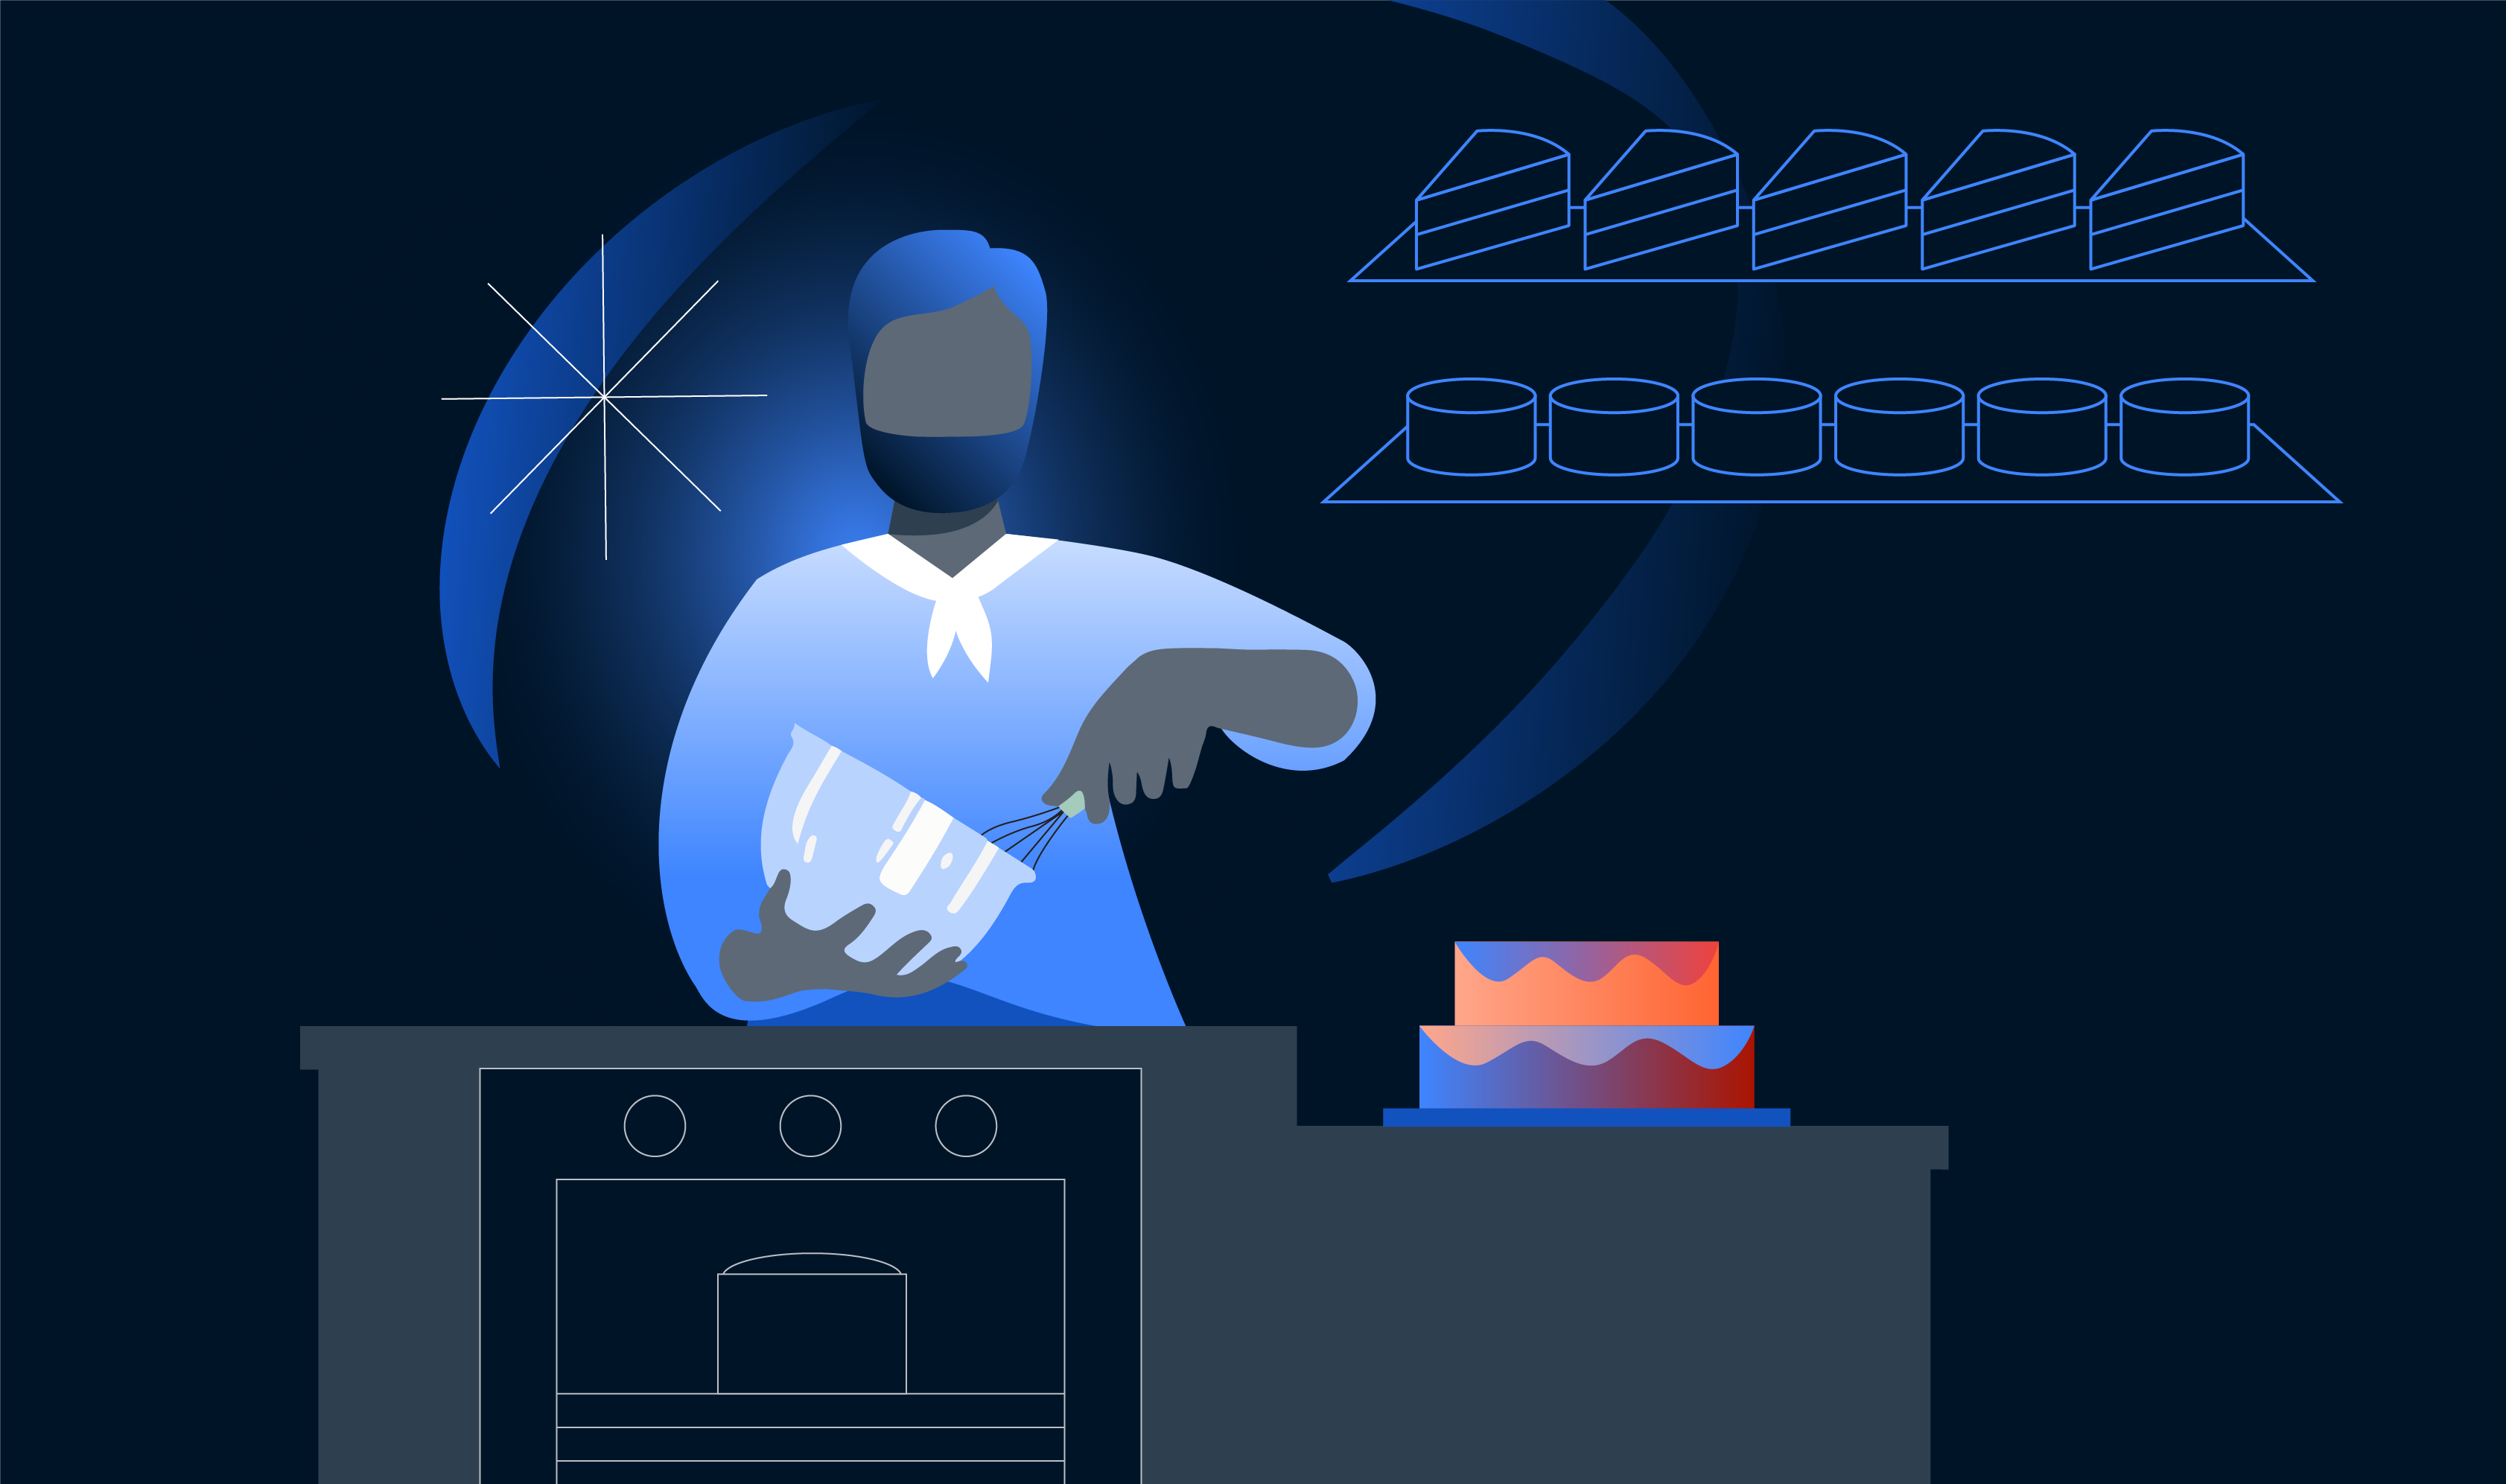
During the first three days of February The Things Network hosted the world’s first LoRa conference in Amsterdam.
Divided into Practical Skills on the first day, Keynotes on the second and a Community Day on the third, discussions ranged from how to keep livestock safe and how to hinder drug smuggling in containers, to future extension to the LoRaWAN protocol to allow GPS-less localisation of devices. I was invited to speak on my hobby project TTN Mapper. This is a system I started building while I lived in Holland, purely to answer a simple question: How well does this promising new technology, LoRa, really perform?
In the past two years TTN Mapper grew to be one of the largest community projects built on top of The Things Network. The system is based on methods I developed during my masters degree in Electronic Engineering at the University of Stellenbosch. With the bicycle culture in The Netherlands many people set out to follow my example of cycling around cities to measure the coverage of The Things network.
As the number of contributors grew the requirements for the system changed. This also introduced a few challenges. I wanted it to be easy for people to contribute their data points, for a wide range of data formats to be supported, to make results available online, but this also meant I had to filter outliers and bad data and to ensure the system could scale.
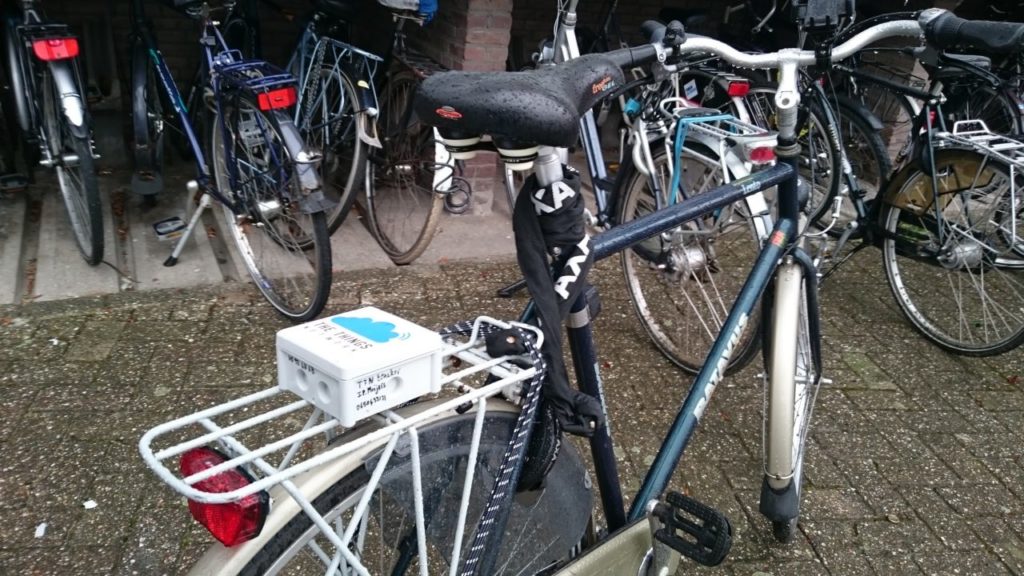
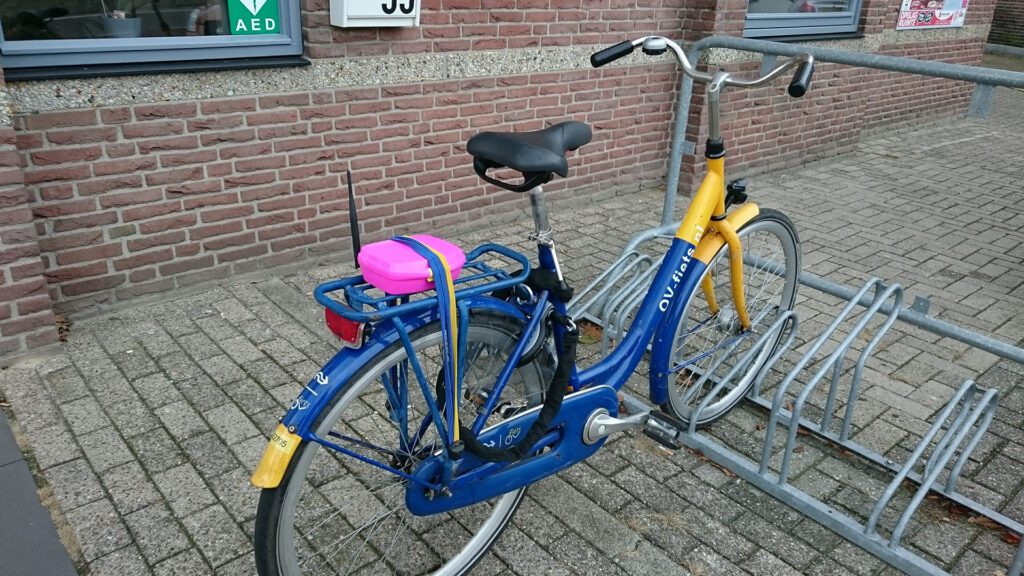
LoRdrivers, as we call the community members that go out on the road to map coverage, mainly use one of two methods to send data to TTN Mapper. Using any LoRaWAN device, one send a message. This message is received and forwarded by The Things Network and delivered to the users smartphone where the TTN Mapper app is running. The app reads the signal strength from the message and geotags it using the smartphones GPS. This data is uploaded to TTN Mapper. This is by far the easiest way to map coverage. The second method is to use a LoRaWAN end device with a GPS, sending its own coordinates in the payload of the message it sends via TTN. These coordinates are received by TTN Mapper where the metadata is geotagged. No smartphone is required.
Since December 2015, 1477 LoRdrivers have contributed more than 3 million measurements. In total they have discovered 2200 different gateways in 6 of the 7 continents. What has been exciting is how to visualise this amount of data and serve it out on a website to thousands of users.
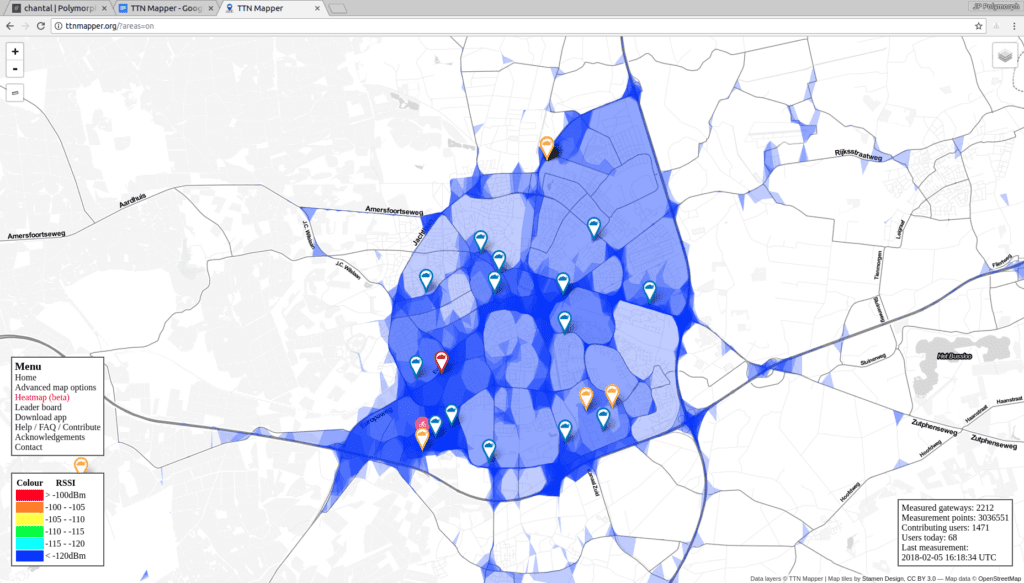
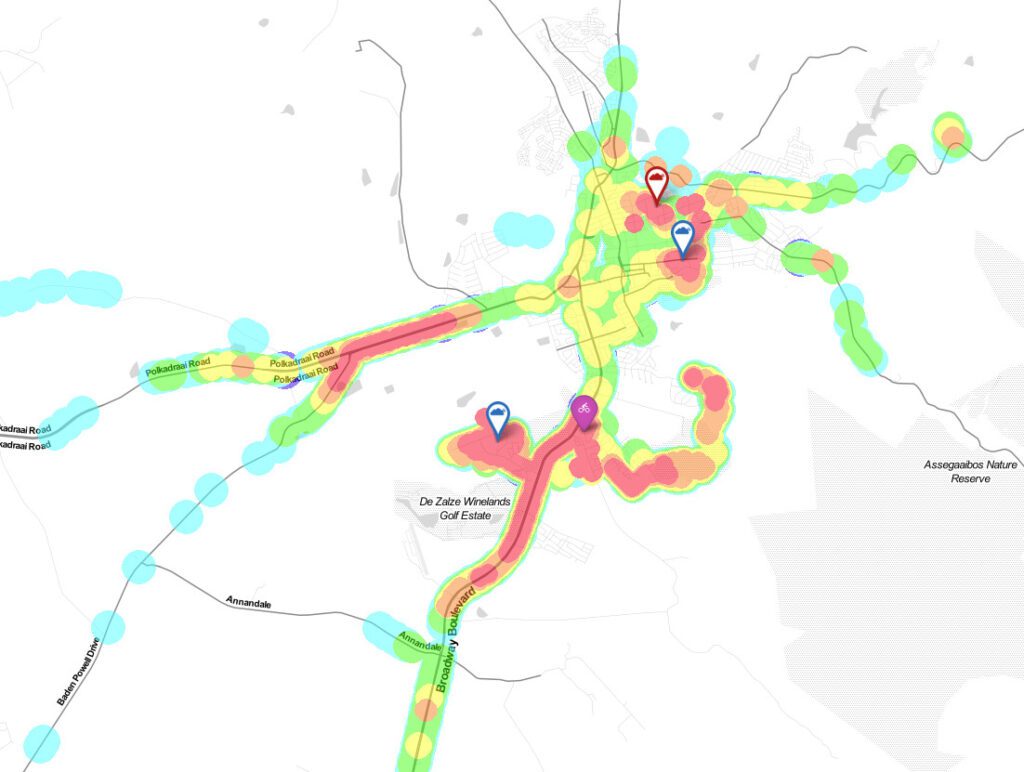
There are plenty of ways to visualise data on a map. Some great examples out there are Safecast and OpenSignal. There is however always a tradeoff between accurate visualisation, visual pleasing maps and scalability. TTN Mapper makes use of multiple methods, but from a community poll at the conference two ones stood out. That is the alpha shape visualisation and the point based heatmaps.
To create an alphashape layer you take all datapoints and connect them, forming a lot of small triangles. When a triangle’s surface area is larger than some parameter “alpha”, you delete that triangle. What you end up with is a polygon that only covers the areas where you successfully communicated via the network.
An alternative way is to draw circles at the locations where you sent messages via the network. If you make the radius of the circle inversely proportional to the signal strength, it allows you to see areas with weak signal, without obscuring them by areas with strong signals.
The conference was a really great experience. Meeting people you have only talked to online and seeing the projects they are working on is really nice. Getting direct feedback from them and learning how they build their systems is an incredible learning experienced.
Except for the other Things Network community members there were also senior engineers from international companies, like Microchip, Laird, ARM, STMicro and Semtech that builds LoRaWAN equipment. Being able to have a conversation with these engineers and decision makers and having a direct input in how they will push the technology forward is really valuable.
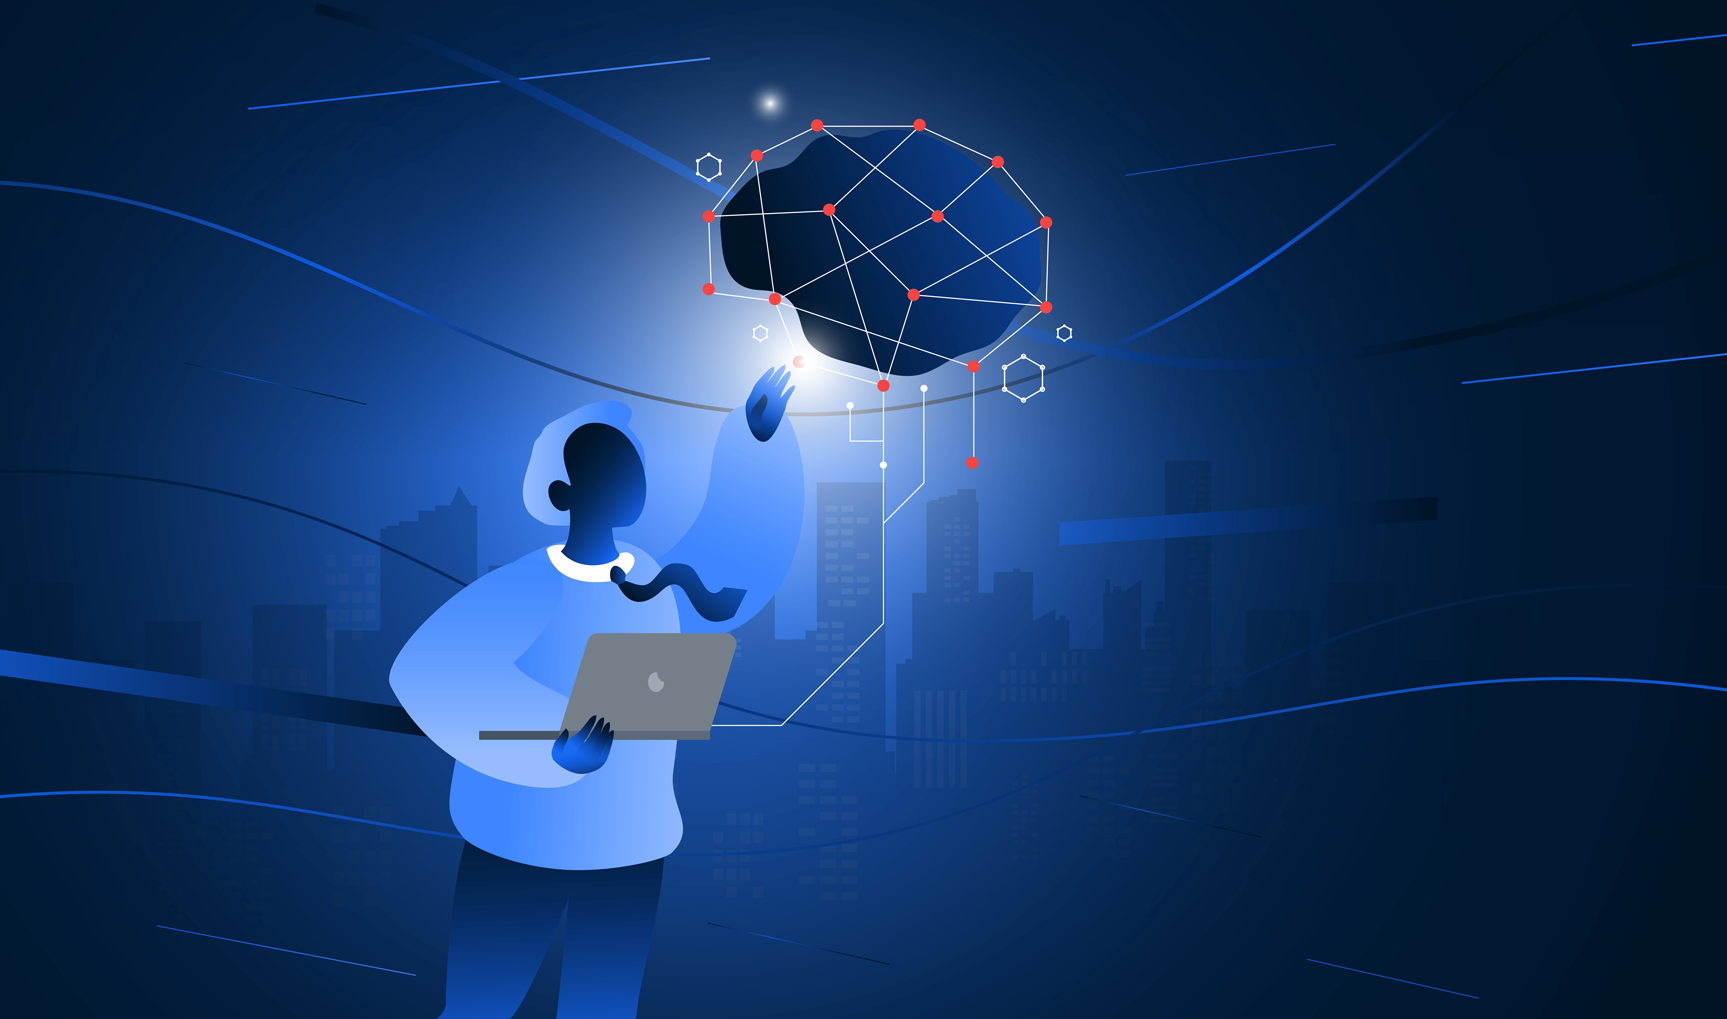
While building TTN Mapper I learned that the visualisation of data gathered by IoT devices is key for this new technology to catch on. At Polymorph we specialise in user interfaces and the experience around it. With our data science partners we can take the raw data gathered from a wide range of IoT devices and present it in a way that is useful and which will make the difference that IoT promises.